How to Find the Most Replayed Part of a YouTube Video (and Turn It Into a Clip)
YouTube most replayed: what the graph means, why it's not showing, how to get the exact timestamps for free, and how to turn the peaks into Shorts.
To find the most replayed part of a YouTube video:
- Open Renderster's free most replayed tool and paste the video link.
- Click Show replays to see the replay graph and the top moments, with exact start and end times.
- Click a moment to jump there on YouTube, or click Get clips to turn the peaks into Shorts.
Open the free most replayed tool →
What "Most replayed" is
"Most replayed" is a graph YouTube draws over the progress bar of a video. It shows which parts viewers watched again. The higher the line at a point, the more often people went back to that moment. The highest peak gets a small "Most replayed" label when you hover over it.
YouTube builds it from real viewing: people skipping back, scrubbing to a moment, rewatching a scene. So the peaks tend to be:
- The punchline of a joke.
- The answer to the question the title asks.
- A play in a match, a trick, a reveal.
- A step in a tutorial that people needed to see twice.
- A moment someone shared with a timestamp.
That last point matters. A peak doesn't always mean "this is great". Sometimes it means "this was confusing" (a tutorial step people rewatch to follow) or "this is where everyone skipped to" (people jumping past a long intro). Either way, it tells you where attention went, and that's the raw material for a clip.
How to see it (desktop and mobile)
On a computer: open the video on youtube.com and move your mouse over the progress bar. A light gray graph appears just above the bar. Move along it to see the peaks; the top one may show the "Most replayed" label with a preview frame.
On a phone: in the YouTube app, tap the video to show the controls, then press and drag along the progress bar. The graph shows up above the bar while you drag.
The YouTube graph has two limits. It has no numbers: you see the shape, not the time of each peak, so you have to scrub to find exactly where a peak starts and ends. And you can't export it or compare it with anything. That's what the free tool is for (below).
Why it's not showing
If you don't see the graph, the usual reasons are:
- The video doesn't have enough views yet. YouTube only draws the graph once enough people have watched. YouTube doesn't publish the exact number, so a new upload or a small channel's video often has no graph at all.
- It's too early. A video published today may get the graph after a few days of views.
- You're not hovering or dragging. On desktop, the graph only appears while the pointer is over the progress bar; on mobile, while you drag.
- It's a live stream in progress, or a format where YouTube doesn't show it.
- Your app or browser shows a different player. Embedded players on other sites and some older app versions may not show it. Try the video on youtube.com.
Our tool reads the same data YouTube uses for the graph. If YouTube has no graph for a video, the tool says so: "YouTube does not show a replay graph for this video yet (it needs enough views)."
Get the exact timestamps (free tool)
The most replayed tool turns the graph into numbers. Paste any YouTube link (watch, youtu.be, Shorts or embed) and click Show replays. No account.
You get:
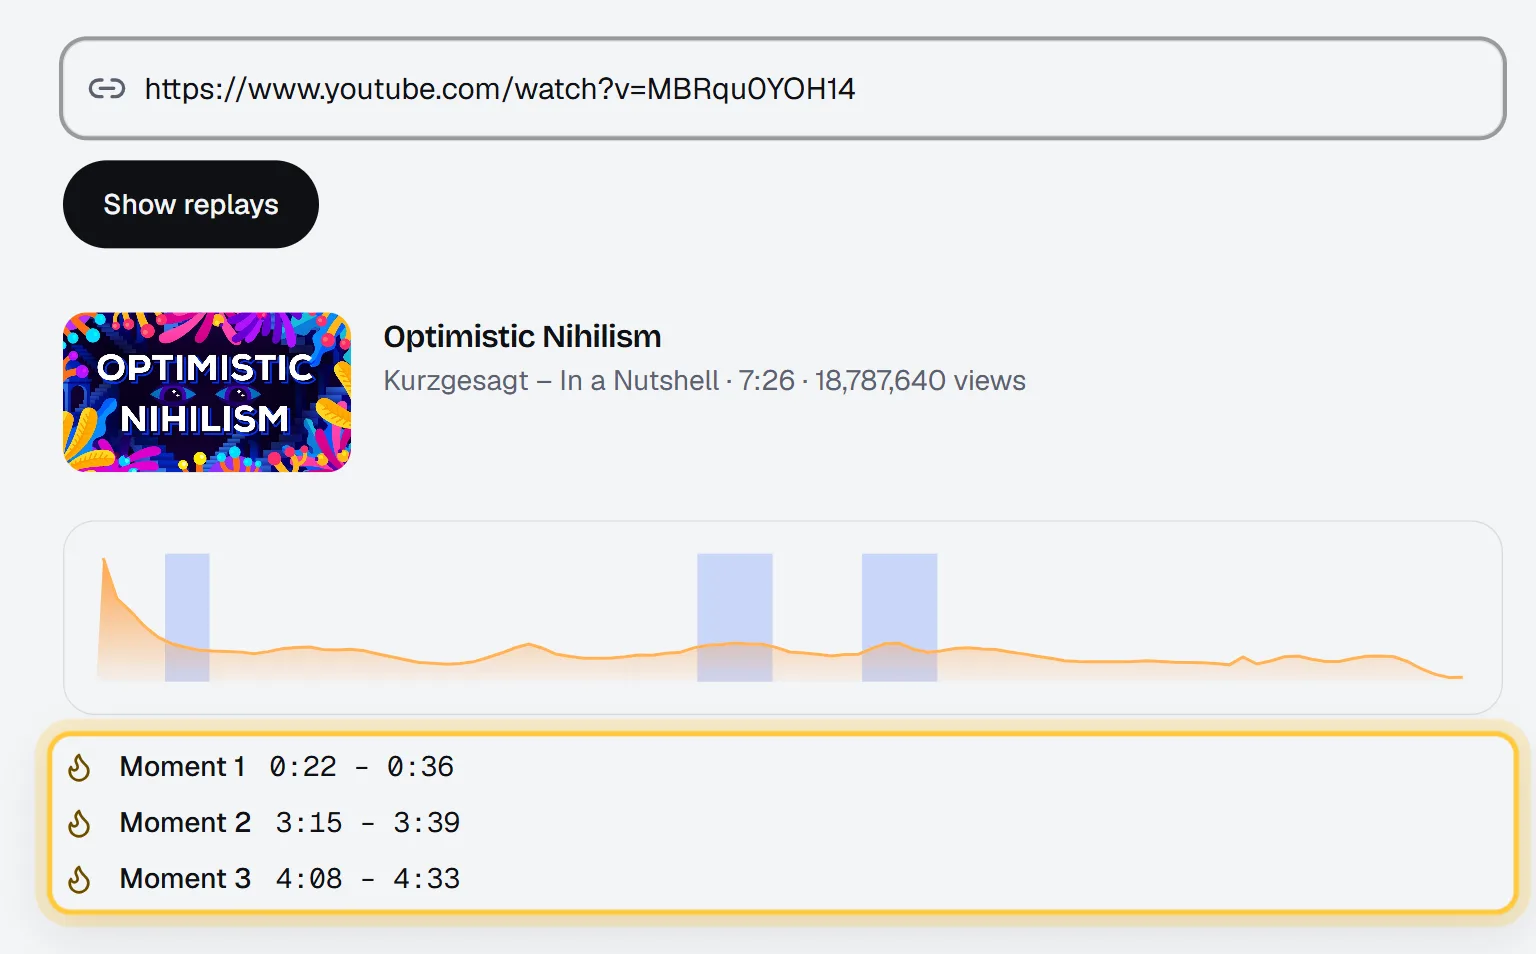
- The video card: thumbnail, title, channel, length and view count.
- The replay graph, drawn wide so the peaks are easy to read, with the top moments shaded on it.
- Up to 3 top moments, listed in video order as Moment 1, Moment 2, Moment 3, each with a start and end time, like
12:04 – 12:31. Click a time and the video opens on YouTube at that second.
How the moments are picked, so you know what you're looking at:
- The tool takes the strongest points of YouTube's graph and adds about 10 seconds on each side of each one. That gives a window long enough to be a clip, not a single second.
- The first 5% of the video is left out. Almost everyone watches the opening, so the start of nearly every video "peaks". It's not useful, so it's skipped.
- The moments never overlap, so you get 3 different parts of the video, not 3 versions of the same peak.
If the video has no graph, you'll see the note instead:
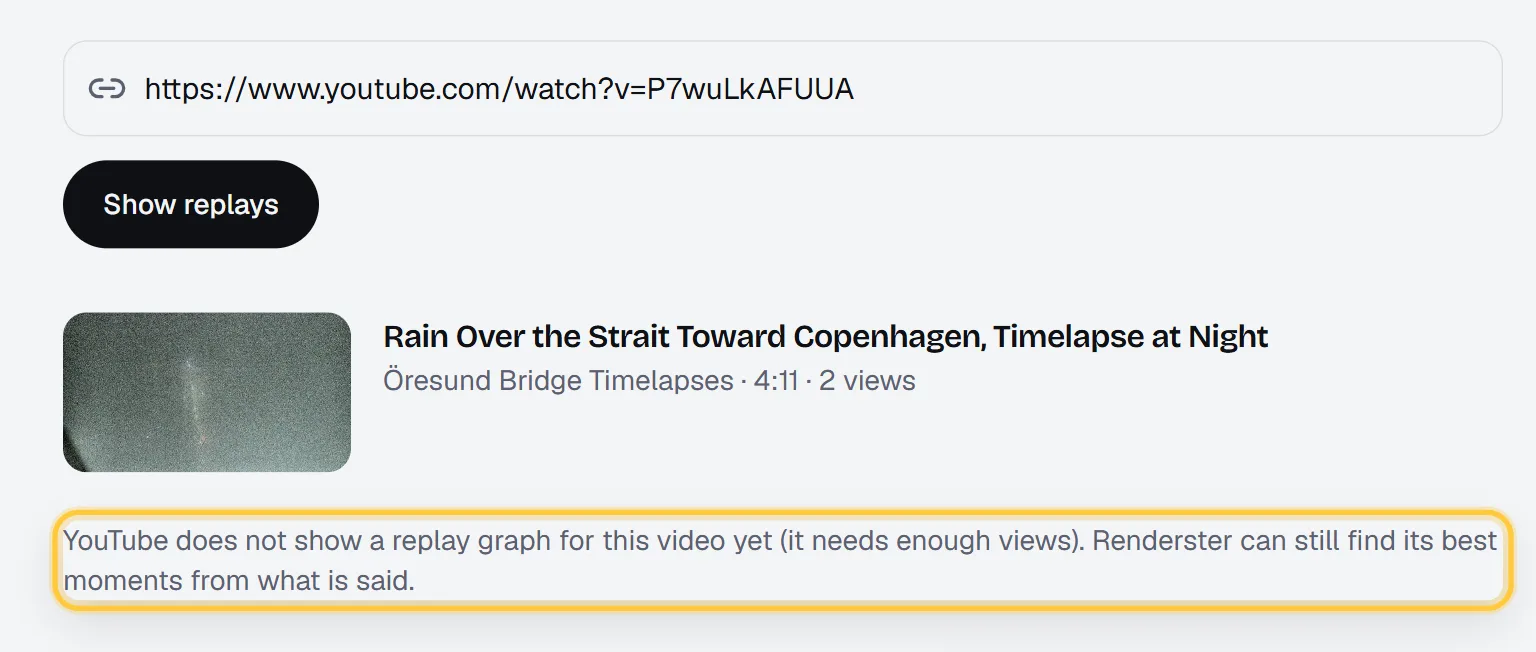
Limits: the tool is YouTube only, public videos only, and a few videos a day per person. Recently checked videos come back from a cache, so popular videos load fast.
Turn the peaks into Shorts automatically
Knowing where the peak is gets you halfway. You still have to cut it, crop it to vertical, add captions and write a title. Under the result, the tool has a box called "Turn this video into clips". Click Get clips and you land on Renderster's clips form with the link already filled in. (You'll need to sign in; the Free plan includes one clips job with up to 3 clips.)
When you paste a YouTube link that has a replay graph, the preview card on the Media page shows the graph as a small line, with a note: "We will favor the moments viewers replay the most."
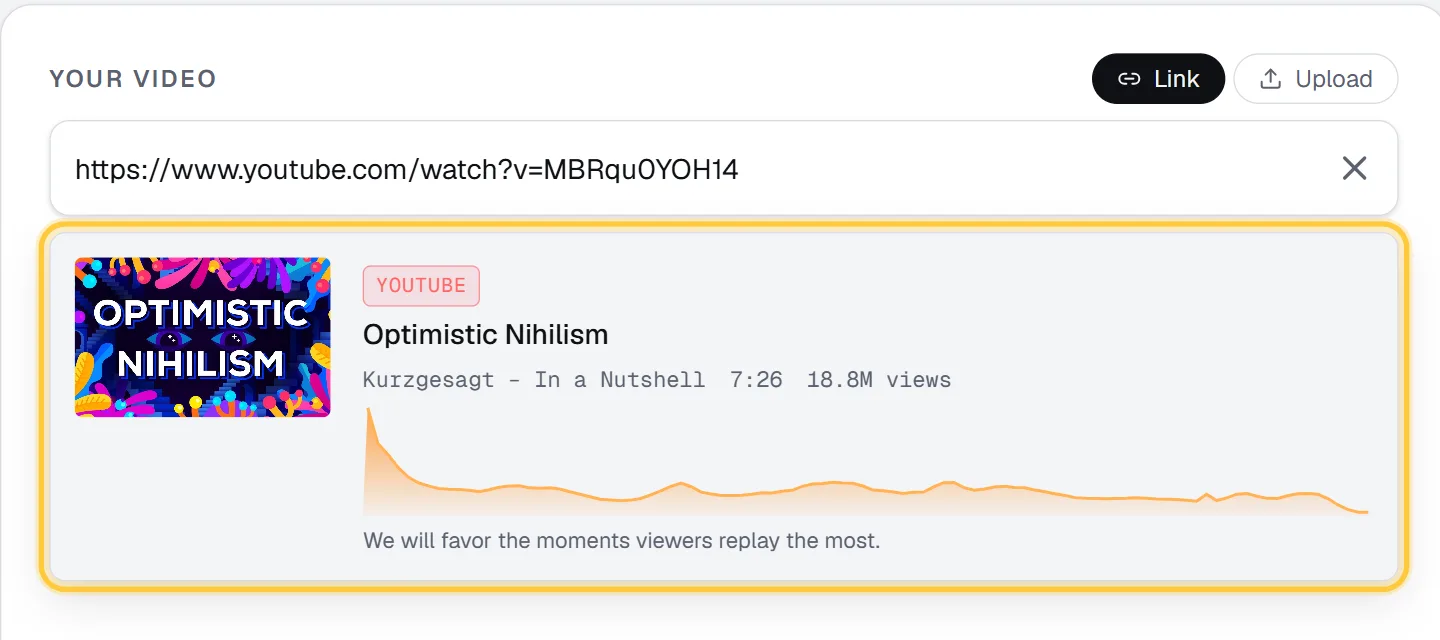
Here's what "favor" means in practice:
- The AI is told where the peaks are. Before it picks moments, it gets the most rewatched parts of the video along with the transcript.
- Replays count in the score. Each candidate clip gets a final score that mixes the AI's rating of the moment (about half), how replayed that stretch is (about a third), and the audio energy. A good line in a replayed stretch beats a good line nobody went back to.
- No speech? Replays drive it. For music, sports or anything without talking, set Pick moments by to The video only (no speech) under More options. Clips are then picked from replays, energy and scene changes.
The clip still has to work on its own. A peak where people rewatched a confusing step won't make a good Short, and the AI's rating catches that. Replays are a strong signal, not the only one.
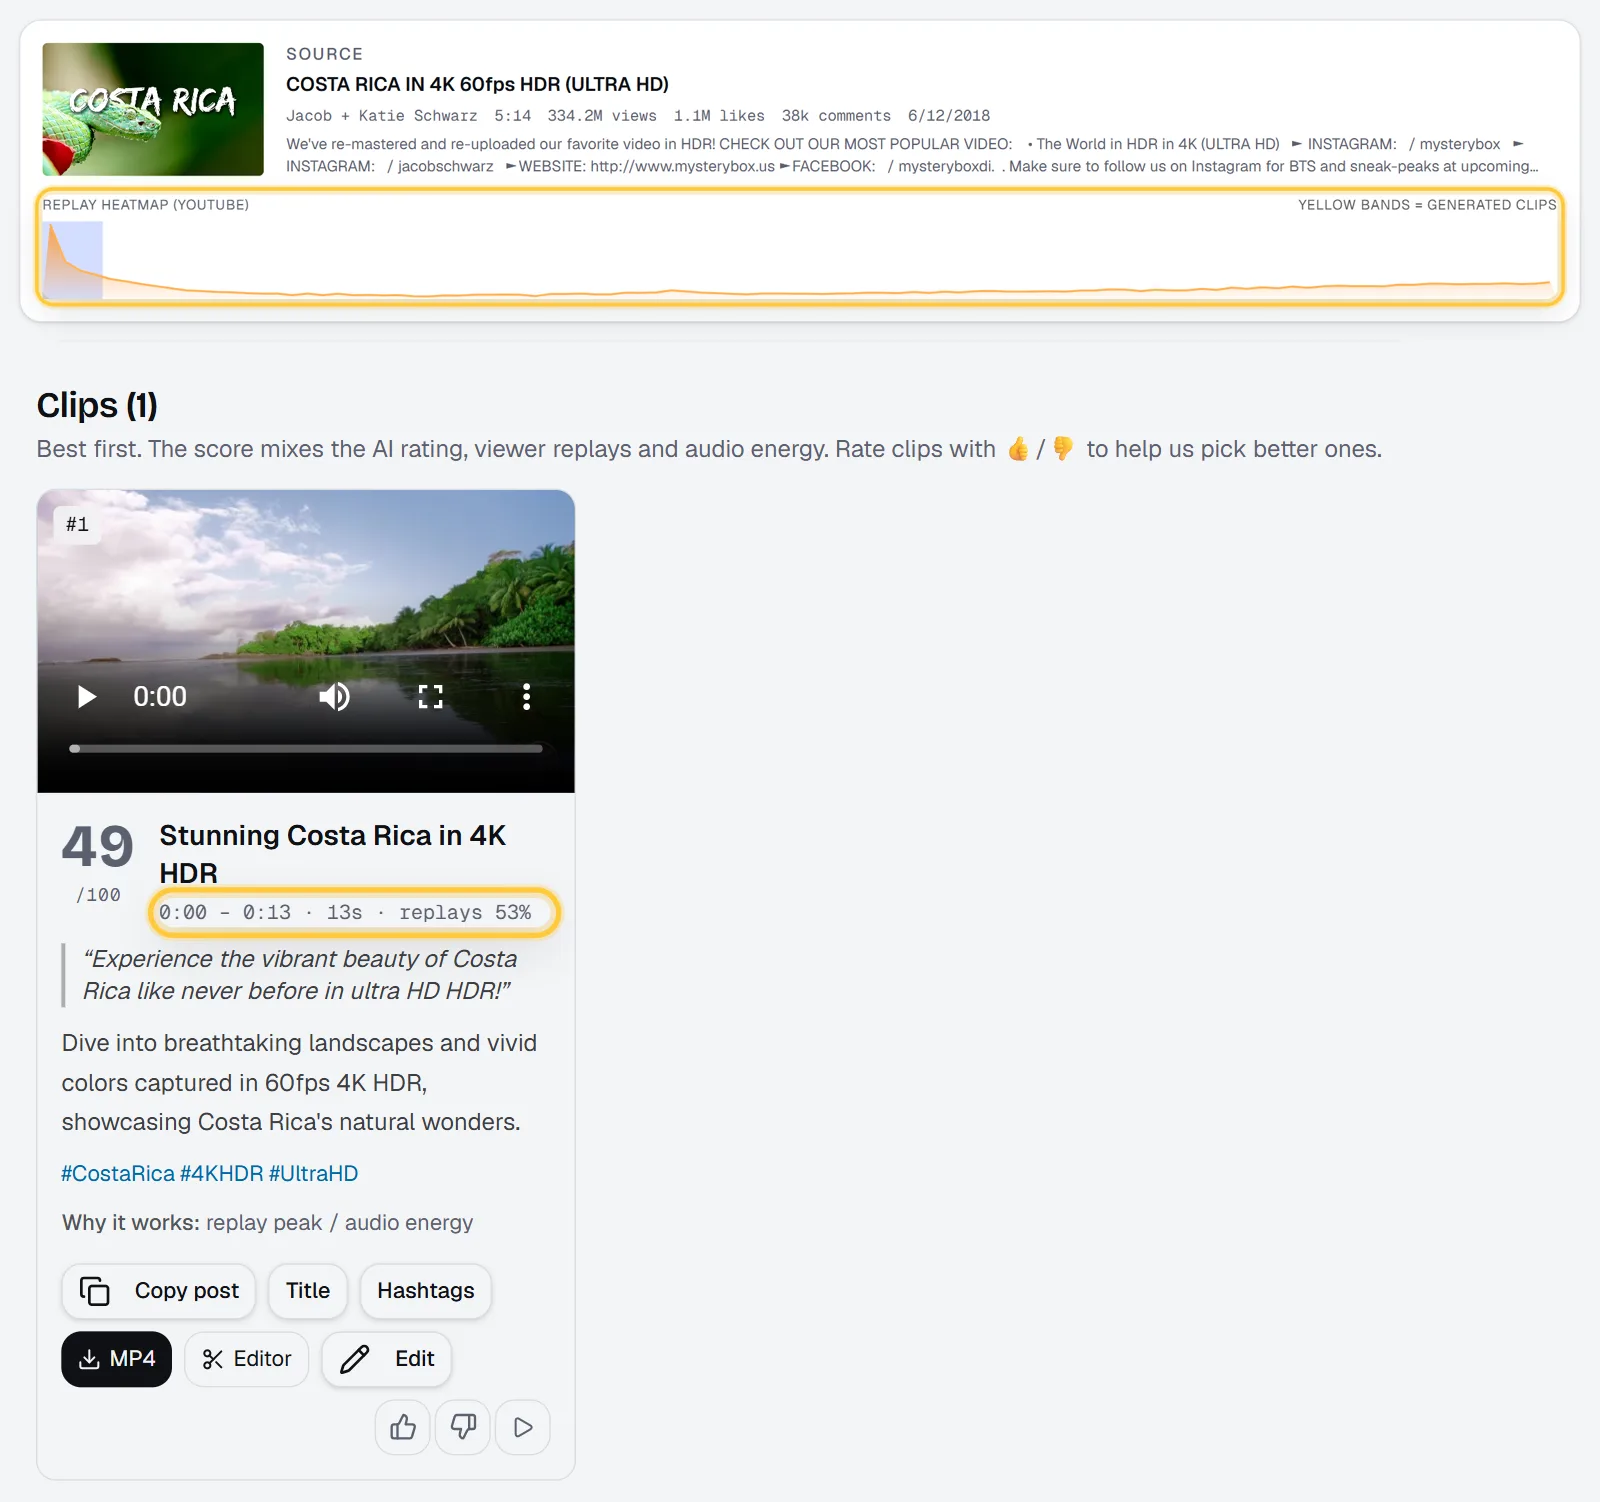
When the job is done, the Source card on the job page shows the Replay heatmap (YouTube), with yellow bands marking where each clip came from. Each clip card also shows how replayed its stretch is, as "replays" and a percentage, next to its time range.
A clips job costs 7 credits, whatever the length of the video. On the Starter plan that's about $0.34 per video; see pricing. The full walkthrough of the clips form is in how to turn a YouTube video into Shorts. For match highlights, Renderster for sports has examples.
To do it for every new upload, the same job is one API call (POST /media with "type": "clips"); the docs have the details, and the n8n guide shows how to trigger it on each new video.
Using it to plan your next video
The graph isn't only for clipping. Run your last few videos through the tool, or a few videos from channels in your niche, and look for patterns:
- What do the peaks have in common? A demo, a number, a strong opinion, a story? Make more of that, earlier in the video.
- Is a peak right after a slow part? People may be skipping your intro or a sponsor segment. Shorten it.
- Does a tutorial peak on one step? That step may be too fast. Slow it down, add a zoom, or make a separate short video just for it.
- Do the same topics peak across a competitor's videos? That's demand. Cover it your way.
- Is there no graph on your videos yet? Then your own retention data in YouTube Studio analytics is the place to look, along with what people say in comments.
Since the graph only shows when a video has enough views, start with your most-watched videos. Those are also the best ones to clip first.
All our free tools, including the YouTube transcript tool, are on /tools.
FAQ
How do I find the most replayed part of a YouTube video?
On youtube.com, hover over the progress bar and look at the gray graph above it; the highest point is the most replayed part. On mobile, drag along the progress bar. For exact start and end times, paste the link into Renderster's free most replayed tool.
Why is "Most replayed" not showing on a video?
YouTube only shows the graph once a video has enough views, so new videos and small channels often don't have it. It also only appears while you hover over (or drag) the progress bar, and may not show in embedded players or on live streams.
What does the YouTube most replayed graph mean?
It shows which parts of the video viewers watched again. Higher points mean more rewatching. Peaks are often punchlines, key answers, highlights, or steps people needed to see twice.
Can I get the timestamps of the most replayed moments?
Yes. Renderster's free most replayed tool lists up to 3 top moments with start and end times (about 10 seconds around each peak, skipping the first 5% of the video) and links each one to that second on YouTube. No account needed.
Can I see the most replayed parts of my own video in YouTube Studio?
YouTube Studio shows your own audience retention in the video's analytics, which is a related but different graph (who kept watching, rather than what was rewatched). The most replayed graph appears on the watch page once the video has enough views.
How do I turn the most replayed part into a Short?
Click Get clips in the free tool, or paste the link on Renderster's Media page and pick Clips. The AI is given the replay peaks and favors those moments, then crops to vertical and adds captions, a title and hashtags. One clips job is 7 credits, and the Free plan includes one job with up to 3 clips.